1 Introduction
I found 3d visualization is really useful for understanding MRI results. Here is a brief guide which is mainly based on this paper.
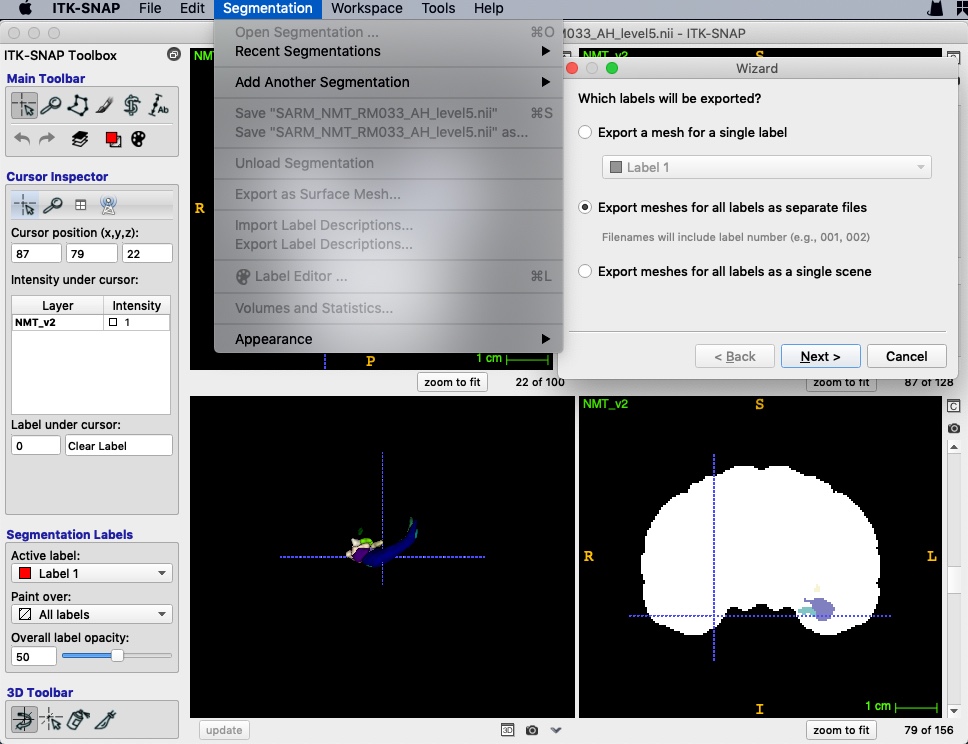
2 Convert nii to VTK
First of all, we should convert nii files to VTK format using ITK-SNAP.
- Open a main image (e.g. whole brain mask).
- Open a segmentation (e.g. ROIs).
- Export as surface mesh and select labels.
- Save as “VTK PolyData File”. Separate files will be named as “prefix+value”.
- A 3d view will be open in the bottom-left window after saving.
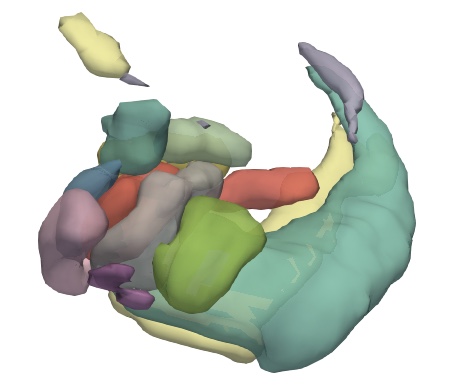
3 Render in 3d
ParaView is an open source visualization application which could render VTK files as surface in 3d.
- Open VTK files, and press Apply (Open as a group will generate time series).
- Show all in the pipeline browser.
- Select every file and add a
Group Datasetsfilter. - Change properties.
- Save state.
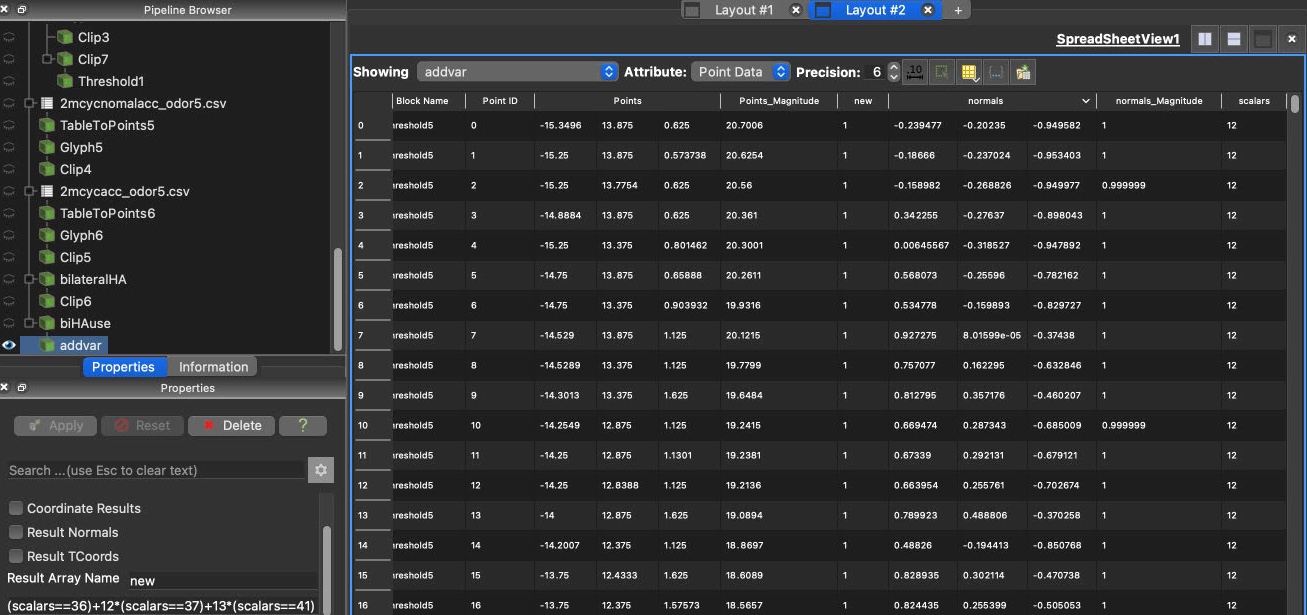
4 Filtering data
In ParaView, filters are pipeline modules or algorithms that have inputs and outputs. Here are some useful filters.
GroupDatasets: groups multiple datasets to create a single data set (without actually duplicate the heavy data)Glyph: place markers or glyphs at point locations in the input dataset.Threshold: cells that have scalars within the specified range (include the lower and upper threshold) will be passed through the filter.Clip: clip any dataset using either an implicit function (such as a plane, sphere, or a box)Calculator: computes a new data array or new point coordinates as a function of existing input arrays. The name of variable is case sensitive. Results can be seen in the spreadsheet view.